Gold (XAU/USD) has dropped in price, falling to around $2,340 after recent US economic data. Reports show the US Manufacturing and Services sectors grew more than expected in May. This could lead to higher interest rates to control inflation, which directly impacts Gold prices.
Higher interest rates are bad for Gold because it doesn’t generate interest, unlike other investments. As a result, when interest rates rise, Gold becomes less attractive to investors. Let’s break down what’s happening with Gold and what we can expect moving forward.
How US Economic Data is Affecting Gold
The recent drop in Gold prices came after stronger-than-expected US economic data for May. The US S&P Global Manufacturing PMI rose to 50.9 from 50.0 in April, and the Services PMI also increased to 54.8, beating forecasts.
This positive data strengthened the US Dollar, as it signaled that the Federal Reserve may need to keep interest rates high to control inflation. Since higher interest rates make Gold less appealing, the price of Gold fell as the US Dollar gained strength.
Federal Reserve Meeting’s Impact on Gold
Gold’s price drop accelerated after the release of the Federal Open Market Committee (FOMC) meeting minutes. These minutes showed that policymakers aren’t ready to lower interest rates anytime soon. In fact, they might even raise them due to ongoing inflation concerns.
This hawkish outlook led to a stronger US Dollar, which put more pressure on Gold prices. A strong Dollar typically pushes Gold prices lower.
What to Watch Next for Gold
The next important data for Gold will be the US Purchasing Manager Index (PMI) for May. It will be released on Thursday at 13:45 GMT. Positive data may push Gold prices lower, while weaker data could help Gold recover.
Technical Analysis: Gold’s Trendline at Risk
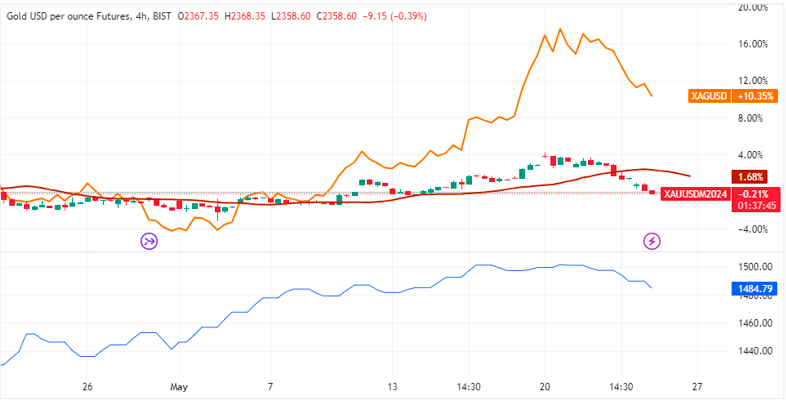
Looking at the charts, Gold is close to breaking below a key trendline that has supported its price since February. If this trendline breaks, Gold could drop even further. Traders hoping for Gold prices to rise may need to rethink their strategy.
XAU/USD Daily Chart
If the trendline breaks, Gold may fall to $2,305 or even $2,275. A clear break would likely come with a long red candle or three consecutive red candles, signaling more price drops.
While Gold’s long-term trend is positive, the short-term outlook is bearish. If Gold manages to break its all-time high of $2,450, it could aim for $2,500 next.
Conclusion
US economic data and the Federal Reserve’s stance on interest rates are weighing down Gold prices. With the price approaching a critical trendline, the next move depends on upcoming data and market reactions. Investors should watch the PMI data and the potential trendline break to better understand where Gold is heading next. For more technical analysis, visit Daily Gold Signal. For daily Gold updates, visit Daily Gold Update.