Gold market analysis (XAU/USD) has managed to recover from previous losses, trading near $2,350 on Tuesday. This recovery is largely due to a weakening US Dollar and shifting market sentiment, both of which are driving investors towards safe-haven assets like gold. Additionally, concerns over decreasing demand in China, one of the world’s largest gold markets, have also contributed to gold’s recent uptick.
Drop in China’s Gold Imports
In April, gold imports to China from Hong Kong fell sharply by 38% compared to March. According to data from the Hong Kong Census and Statistics Department, China imported just 34.6 metric tons of gold in April, down from 55.8 metric tons in the previous month. This decline is a sharp contrast to the first quarter of 2024 when China’s gold consumption rose by 5.94% compared to the previous year, with a total of 308.91 metric tons consumed.
The drop in imports could signal reduced demand in China, which plays a crucial role in shaping global gold prices. Most of the gold enters China through Hong Kong, where it is stored before being transported to the mainland.
Technical Analysis: Bear Flag Forming in Gold Market?
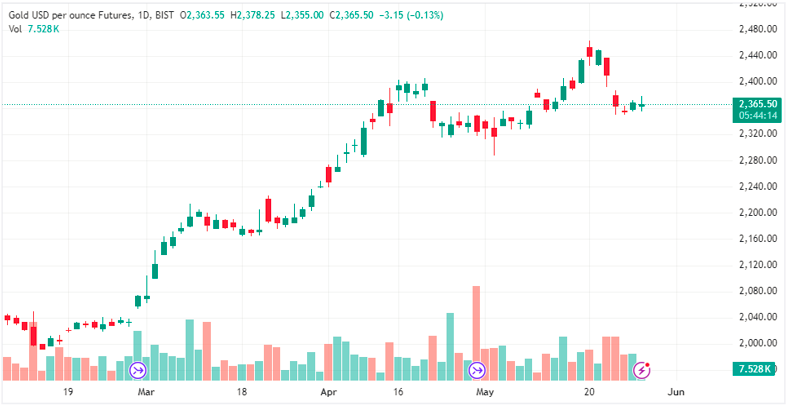
Based on technical indicators, the price of gold remains within a rectangular trading range. This range, shown by a red pattern on the charts, suggests a potential continuation of the recent downtrend. After a significant drop from its highs, XAU/USD has moved below a key trendline, hinting at a short-term bearish sentiment.
Currently, it may be more advantageous to consider short positions, as the market is leaning towards a downward trend.
XAU/USD Forecast 4-Hour Chart Insights
After hitting a low on May 24th, the price of gold showed a slight recovery. However, this rebound could be part of a “Bear Flag” pattern, indicating that a further drop is possible. If gold breaks below the May 24th low of $2,325, prices might fall to around $2,300 or potentially as low as $2,272. This level is supported by the previous high recorded on May 3rd.
A key indicator, Moving Average Convergence Divergence (MACD), showed a positive signal earlier this week, though it weakened on Tuesday. This suggests that the downward trend may continue unless there’s a major shift in momentum.
What Could Reverse the Trend?
While medium- and long-term outlooks for gold remain optimistic, the short-term picture appears bleak. For a reversal to occur, the price would need to break back above the $2,375 trendline. A clear sign of this reversal would be a strong price rally, such as a long green candle or a sequence of three green candles.
To get more in-depth insights and updates on gold trading signals, visit Daily Gold Signal.