
The recent rise in Gold price forecast (XAU/USD) has faced a pause as the US Dollar (USD) has strengthened, ending a three-day upward streak for gold. This change came after hawkish comments from Federal Reserve (Fed) officials and stronger-than-expected US economic data. As a result, the possibility of a Fed rate cut in September has decreased, putting pressure on gold prices, which are denominated in USD. However, global geopolitical tensions and the potential increase in gold demand from central banks may support gold prices in the near future.
Impact of the Fed’s Beige Book and Economic Data
Gold traders are closely watching the Fed’s Beige Book report and an upcoming speech from Fed official John Williams. The US Core Personal Consumption Expenditures Price Index (Core PCE), expected on Friday, could further influence the market. A predicted 0.3% monthly rise and 2.8% year-on-year growth for April may keep inflation high, potentially delaying the Fed’s rate cuts. Higher interest rates typically lower the appeal of gold as they increase the cost of holding non-yielding assets like gold.
Geopolitical Tensions Boosting Safe-Haven Demand
In response to ongoing geopolitical tensions, such as the conflict between Israel and Hamas, safe-haven assets like gold often see higher demand. Israeli airstrikes have escalated tensions, driving more interest in gold. Meanwhile, the World Gold Council reported a withdrawal of 11.3 metric tonnes from global gold-backed ETFs last week, which could also affect gold sentiment.
Short-Term Gold Price Outlook and Technical Levels
At present, Gold price forecast (XAU/USD) is trading at $2359, with a slight drop of 0.14%. This dip follows hawkish Fed remarks and strong US economic reports. The key price pivot is identified at $2351.36, with resistance levels at $2366.30, $2392.21, and $2410.23. If gold breaches these levels, a bullish breakout may lead to higher prices. Conversely, support is found at $2325.13, $2304.38, and $2285.77, with a break below $2350 possibly triggering a larger sell-off.
Gold’s Technical Outlook and Fibonacci Analysis
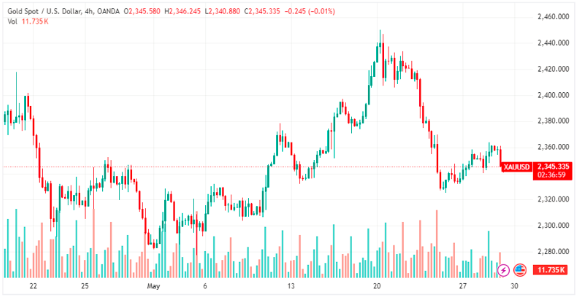
Gold’s technical indicators suggest mixed signals. The 50-day Exponential Moving Average (EMA) is positioned at $2363.35, and the 200-day EMA stands at $2335.99. After completing a 23.6% Fibonacci retracement around $2350, gold remains near the $2359 level. The next major resistance is at the 38.2% Fibonacci retracement, positioned at $2366, which aligns with the 50 EMA. Should gold break above this point, it may reach the 50% retracement at $2379 or even the 61.8% level at $2392.
Conclusion
In summary, gold (XAU/USD) faces resistance near $2366, which aligns with key technical indicators. If it breaks through, prices could rise further. However, a move below the $2350 pivot point may signal further declines. Geopolitical tensions and central bank demand remain key factors in gold’s outlook. For up-to-date daily gold updates, be sure to check out Daily Gold Update, or explore more insights on the Daily Gold Signal page.