
Gold price prediction fell during Thursday’s Asian trading session, mainly due to a stronger US dollar and rising US Treasury yields. Traders are watching for upcoming economic data that could impact interest rates, as gold (XAU/USD) is now priced at $2,325.
How the Dollar and Treasury Yields Are Affecting Gold
The US dollar hit a two-week high, driven by concerns that US interest rates will stay high. As a result, US Treasury yields also increased, making gold less attractive to investors. This has led to gold giving back the gains it made earlier in the week.
Economic Data and Interest Rate Expectations
Gold price prediction are being influenced by expectations around upcoming economic reports. The revised GDP figures for the first quarter, expected later today, may show a strong economy with an annual growth rate of 1.3%. Additionally, the PCE price index, a key measure of inflation used by the Federal Reserve, is expected to rise by 0.3% monthly and 2.8% annually in April.
These reports come after Federal Reserve officials expressed doubt about cutting interest rates soon, making a rate cut in September less likely.
Geopolitical Issues and Central Bank Demand for Gold
Despite the current challenges, ongoing tensions in the Middle East could help gold hold its value as a safe investment. Military actions by Israel and increased gold buying by central banks may prevent gold prices from falling too much in the near term.
Short-Term Gold Price Outlook
Gold (XAU/USD) is currently trading at $2,325. Upcoming US economic data, like the GDP and PCE reports, will likely affect how the market moves. If gold goes above $2,326, it could signal a bullish trend. If it stays below this level, the bearish trend may continue.
Gold Price Technical Analysis
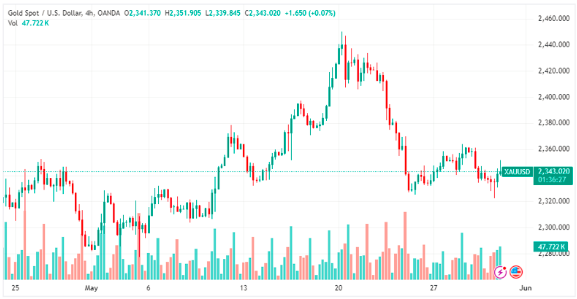
Gold (XAU/USD) is slightly down, trading at $2,324.71, a decrease of 0.05%. The key level to watch is $2,326.04, which acts as the pivot point. Resistance levels are at $2,335.80, $2,351.05, and $2,366.30, while support levels are at $2,304.38, $2,285.77, and $2,269.30.
The 50-day EMA is at $2,357.00, and the 200-day EMA is at $2,335.85, showing a bearish outlook. If gold moves above the pivot point, it could turn bullish. However, staying below this level might lead to lower prices.
Conclusion
Gold’s outlook remains bearish if it stays below $2,335, but a move above this level could lead to a bullish shift. Traders should keep an eye on key technical levels and upcoming economic reports.
For more insights, visit our Daily Gold Updates. To stay updated on gold price trends, check out our daily analysis.