
Gold price (XAU/USD) surged on Thursday, trading in the $2,350s. Weak US data and a shift in tone from Federal Reserve Chairman Jerome Powell have fueled expectations of early rate cuts, making Gold a more attractive investment. This article will delve into the factors driving the Gold price rise and the technical indicators supporting its bullish outlook.
Gold Price Rise Amid Weak US Data
Gold is climbing due to weak US economic data, suggesting the economy is cooling. This raises the likelihood of interest rate cuts by the Federal Reserve. Lower interest rates reduce the opportunity cost of holding non-interest-bearing assets like Gold, increasing its appeal.
Key data contributing to this outlook includes the US ISM Services PMI, which fell to 48.8 in June from 53.8 in May, below the expected 52.5. The Services Prices Paid component, though still in expansion at 56.3, also dropped from 58.1 in May. Additionally, Initial Jobless Claims rose to 238,000, and Continuing Claims reached 1.858 million, the highest since November 2021. The ADP Employment Change showed a rise of 150,000 in June, below May’s figure and the 160,000 forecast.
The Federal Reserve’s June meeting minutes indicated a neutral, data-dependent stance. Despite Chairman Powell’s more optimistic tone on inflation, more data is needed before deciding on rate cuts. The prospect of lower rates benefits Gold price by reducing its holding cost.
Gold Price Gains on Broader Global Factors
Gold appeal is also boosted by geopolitical and macroeconomic factors. Conflicts in the Middle East and Ukraine, along with political shifts in Europe, have driven investors to Gold. In the US, uncertainty around the political landscape, including potential shifts in leadership, further supports Gold’s attractiveness.
The BRICS trading bloc’s push to de-dollarize global trade has also increased demand for Gold price, seen as a viable alternative for countries restricted from Dollar-denominated markets.
Technical Analysis: Gold Price Surpasses 50-day SMA
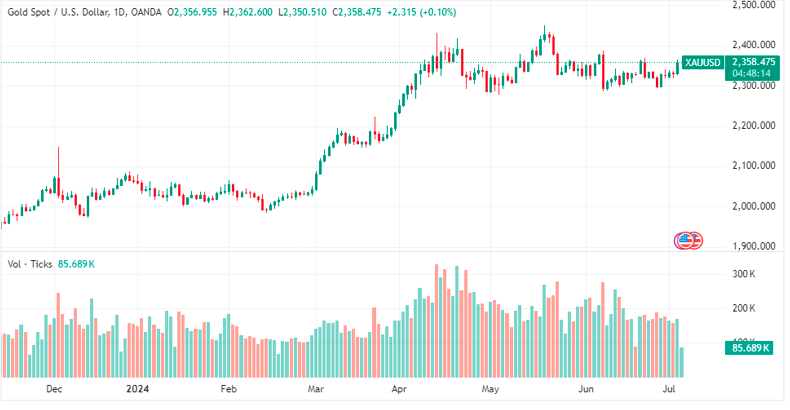
Gold has broken above the 50-day Simple Moving Average (SMA), signaling a bullish shift. This move invalidates the Head and Shoulders (H&S) topping pattern, indicating further gains. The next targets are $2,369 and $2,388. However, if the neckline at $2,279 is broken, a reversal to $2,171 is possible. In the long term, Gold price remains in an uptrend.
Conclusion
Gold price’s recent rise above the 50-day SMA, driven by weak US data and broader global factors, points to a bullish outlook. For more insights on Gold price trends, visit Daily Gold Signal and check out their daily gold updates.