
Gold market update prices fell over 1.50% on Friday, settling around $2,400 as traders booked profits before the weekend. Despite reaching a peak of $2,483 earlier, the yellow metal is poised to end the week with a near 1% loss, currently trading near $2,399 after a high of $2,447.
Gold Market Update Factors Impacting
Several factors contributed to this price fluctuation. China’s economy underperformed expectations, and the potential for former President Donald Trump to win the upcoming elections strengthened the US Dollar. The Dollar Index (DXY) reflects this, with the Greenback expected to close the week with over 0.26% gains.
Political and Economic Influences
Additionally, rumors suggest President Joe Biden might withdraw from the race, with polls indicating a challenge against Trump. Meanwhile, Federal Reserve officials have adopted a slightly dovish tone, but this hasn’t weakened the Dollar. The International Monetary Fund (IMF) advised the Fed to maintain interest rates until late 2024.
The US Dollar Index, which compares the currency to six others, has risen by 0.18% to 104.34. US Treasury bond yields are also rising, with the 10-year Treasury note yielding 4.233%, a three basis points increase.
Daily Market Movements
Weaker-than-expected US Consumer Price Index (CPI) data initially boosted gold market update prices above $2,400. This was driven by the increased likelihood of Fed rate cuts, which reduced US Treasury bond yields. The week’s data included mixed Retail Sales, slowing Industrial Production, and rising unemployment benefits claims, aligning with the Fed’s balanced mandate.
December 2024 Fed funds rate futures suggest a 50 basis points policy easing by year-end. Investors are now focused on speeches from New York Fed President John Williams and Atlanta Fed President Raphael Bostic.
Gold Technical Analysis
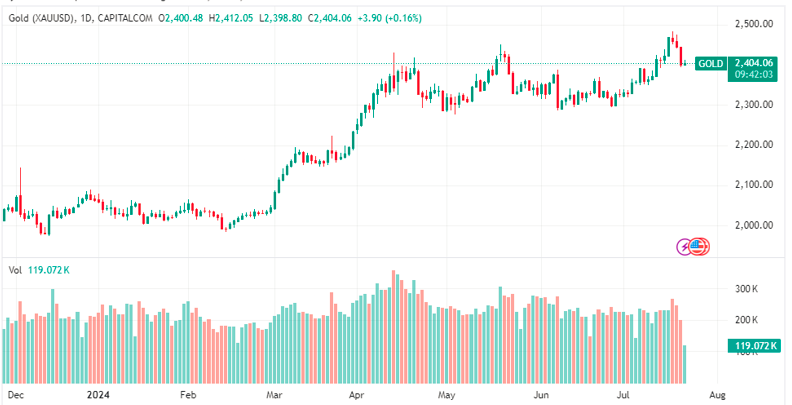
Gold’s recent price drop indicates profit-taking after an 8% rally since June 27. Despite a bullish Relative Strength Index (RSI), short-term momentum favors sellers, with the RSI nearly crossing the 50-neutral line. Initial support is at the July 5 high of $2,392, followed by the 50-day Simple Moving Average (SMA) at $2,357, and then $2,350. Further support is at the 100-day SMA at $2,312.
Conversely, if gold prices hold above $2,400 and surpass $2,450, it could challenge the all-time high of $2,483 and aim for $2,500.
For daily updates on gold prices, visit Daily Gold Signal. For more detailed analyses, check out Daily Gold Updates.