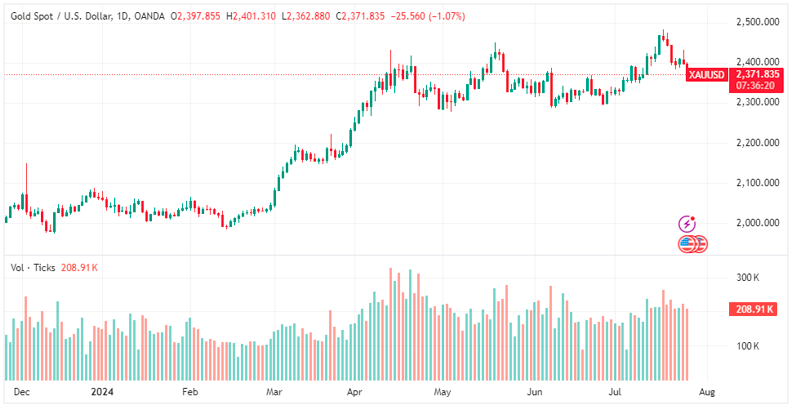
Gold Price Trends Analysis (XAU/USD) has been facing a decline following the release of strong US economic data. Despite its status as a safe haven, Gold is trading over a percentage point lower in the $2,370s. This article delves into the recent Gold price trends and the factors driving these market dynamics.
Technical Selling and US Data Impact
Gold Price Trends Analysis recent drop is partly due to technical selling, influenced by favorable US economic data. Preliminary Q2 Gross Domestic Product (GDP) growth of 2.8% exceeded estimates and the previous quarter’s 1.4%. This robust data suggests a solid US economy, reducing fears of stagflation—a situation where Gold typically performs well. The preliminary S&P Global Purchasing Managers Index (PMI) data for July also plays a role in shaping investor sentiment.
Analysis of Recent US Economic Data
The Q2 GDP data showed a rise of 2.8%, surpassing expectations. This indicates the US economy is strong, which could lead the Federal Reserve to keep interest rates higher for longer. Higher rates reduce the appeal of non-interest-bearing assets like Gold. Additionally, mixed US data, including a 6.6% drop in Durable Goods Orders and a slight decrease in Jobless Claims, adds complexity to the economic outlook.
PMI Data and Its Influence on Gold
Gold was already under pressure following the July S&P Global Composite PMI data, which improved to 55. However, the Manufacturing PMI decreased to 49.5, while the Services PMI rose to 56.0. This mixed data points to robust economic growth with moderated inflation, affecting Gold’s market performance.
Fed Rate Cuts and Gold Price Trends
Expectations of multiple Federal Reserve rate cuts before the year ends typically make non-interest-bearing assets like Gold more attractive. However, the unwinding of the “Trump trade” and lower US bond yields have positively influenced Gold. Polls indicating Kamala Harris leading Donald Trump suggest a potentially less inflationary economic future.
Geopolitical Factors and Indian Demand
Gold could benefit from increased physical demand in India, following a reduction in the Gold import tax. Furthermore, geopolitical developments, such as BRICS+ plans for a Gold-backed reserve currency, might impact Gold’s value. These initiatives aim to limit US economic influence in global conflicts.
Technical Analysis: Gold’s Current Range
Gold continues to trade within a range established since May. The current downward trend may target the 100-day Simple Moving Average (SMA) at around $2,320, with temporary support expected at the 50-day SMA near $2,360. The Moving Average Convergence Divergence (MACD) indicator supports this bearish trend. A rise above $2,483 could signal a continuation of the long-term uptrend.
Gold’s recent performance reflects a combination of technical factors and strong US economic data. Although current trends suggest a downward movement, long-term prospects remain influenced by geopolitical events and changing economic conditions. For the latest updates on Gold prices, visit Daily Gold Signal or explore the Daily Gold Update.