
Gold price trends (XAU/USD) recently faced a decline after briefly approaching $2,470 during Thursday’s North American trading session. This drop came in the wake of stronger-than-expected July Retail Sales data from the US Census Bureau. Understanding how these economic indicators affect gold prices is crucial for investors tracking market trends and future projections.
Impact of US Retail Sales on Gold Price
The US Census Bureau’s July Retail Sales report revealed a significant 1% increase, surpassing the expected 0.3%. This upsurge in consumer spending, especially in the automobile sector, contrasts with June’s contraction of 0.2%. Despite robust Retail Sales, the likelihood of substantial Federal Reserve rate cuts in September appears diminished. Instead, the strong sales data has led to a rebound in both the US Dollar (USD) and bond yields.
Effects on US Dollar and Bond Yields
The US Dollar Index (DXY), which measures the Greenback’s value against major currencies, surged by nearly 0.5% beyond the critical 103.00 resistance level. Similarly, 10-year US Treasury yields climbed close to 3.94%. Higher yields generally weaken non-yielding assets like gold by raising the opportunity cost of holding such investments.
Gold Price Movements and Outlook
Despite the gold price trends recent dip, its short-term outlook remains optimistic. The Federal Reserve’s extended restrictive monetary policy may start to be relaxed in September. The Consumer Price Index (CPI) report for July highlighted a deceleration in annual headline inflation to 2.9%, down from 3% in June. Core CPI, excluding volatile food and energy prices, increased by 3.2%, showing a slight decrease from the prior reading.
Federal Reserve Rate Cut Expectations
The CME FedWatch tool indicates a reduced probability of a 50 basis points (bps) rate cut in September, dropping to 25.5% from 55% the previous week. However, Atlanta Fed President Raphael Bostic suggested that if the labor market weakens, he might support a 50 bps reduction and emphasized the need for timely monetary policy adjustments.
Technical Forecast for Gold Price
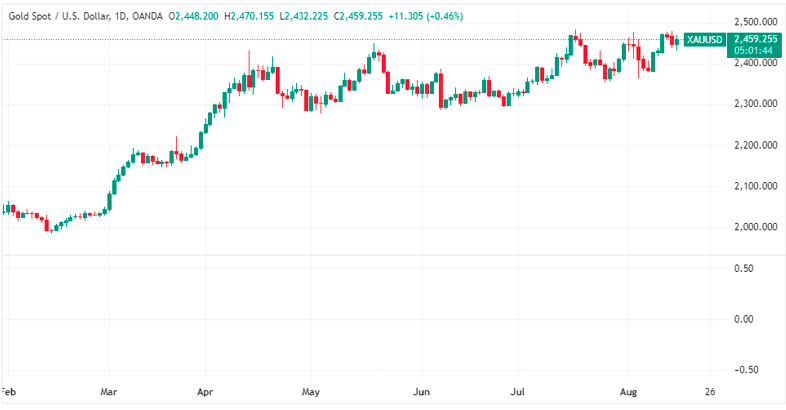
Gold is currently trading in a channel formation on the daily chart. Although it has been moving sideways for over three months, the 50-day Exponential Moving Average (EMA) around $2,390 continues to support gold bulls. The 14-day Relative Strength Index (RSI) remains in the 40.00-60.00 range, indicating market indecisiveness. A break above the all-time high of $2,483.75 could lead to new highs, while the upward-sloping trendline at $2,225 remains a crucial long-term support level.
Conclusion
In summary, while recent economic data has influenced gold prices, the metal’s outlook depends on future Federal Reserve actions and broader market trends. For more details on daily gold updates, visit Daily Gold Signal, or explore the Daily Gold Update.