
Gold recently pulled back to $2,500 following the release of US Consumer Price Index (CPI) data. The data, released on Wednesday, showed inflation figures that were slightly lower than expectations, causing movements in the market. Gold, being sensitive to inflation and dollar trends, responded by retreating after hitting its peak earlier in the trading day.
US Inflation Data Impact
The August CPI data showed a yearly increase of 2.5%, down from July’s 2.9% and slightly below the expected 2.6%. On a monthly basis, inflation matched forecasts at a 0.2% rise. Core CPI, excluding food and energy, stayed at 3.2% annually and increased 0.3% monthly, which was slightly higher than July’s 0.2%.
The market reaction to this data was immediate, with the US Dollar (USD) strengthening. Gold, which often moves inversely to the USD, saw its price dip from the $2,520s down to the $2,500 mark.
Gold in Anticipation of Fed’s Interest Rate Decision
Gold prices are fluctuating in a range between $2,480 and $2,530 as investors look toward the Federal Reserve’s upcoming decision on interest rates. The Fed is expected to announce a 25 basis points (bps) rate cut, but some experts predict a larger cut of 50 bps, which could make gold more attractive since it doesn’t offer interest.
If the larger cut happens, Gold’s appeal could rise, potentially lifting its price in comparison to other investments. Investors continue to watch these developments closely, as interest rate decisions often affect gold’s standing in the gold market trends.
Political and Geopolitical Influences on Gold
Political events have also played a role in moving gold prices. For example, a weaker US Dollar helped gold earlier this week due to the results of a recent debate involving US political leaders. According to analysts, Vice President Kamala Harris had a better outcome, leading to market adjustments.
International tensions are also adding pressure. Conflicts in Gaza and rising tensions between Ukraine and Russia are contributing to global uncertainty, increasing the demand for safe-haven assets like gold.
Technical Analysis: Gold’s Trading Range and Outlook
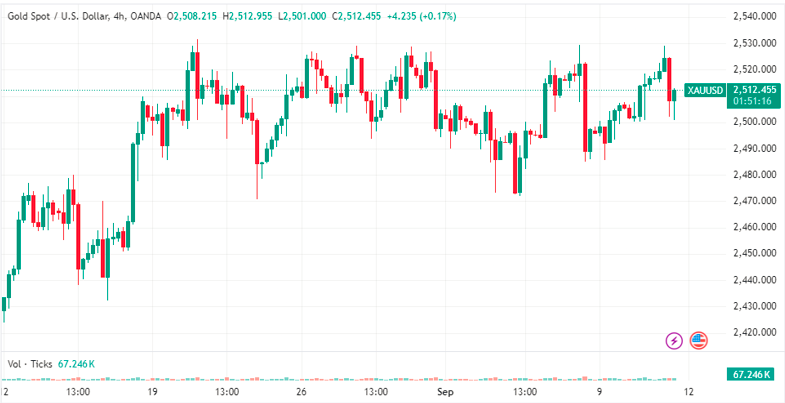
Gold’s technical performance shows that it remains within a sideways trading range, fluctuating between $2,480 and the all-time high of $2,531. While the longer-term trend remains bullish, the yellow metal may continue to oscillate within this range.
A break above $2,531 could signal a push toward the $2,550 level, a target generated from the previous breakout in mid-August. However, should gold fall below $2,460, it might signal a potential shift, weakening the bullish outlook.
Conclusion
Gold’s recent movements in response to US CPI data and upcoming Federal Reserve decisions highlight its volatility in the market. While inflation and interest rate trends drive short-term fluctuations, long-term signals suggest a bullish future. Investors should continue to monitor economic data and geopolitical developments to anticipate further movements in gold prices.
For regular updates on the gold market, you can explore more at Daily Gold Signal. To stay informed on gold price changes, visit Daily Gold Update.