
Gold price update saw a slight decline on Wednesday, retreating by half a percent to trade around $2,640 per ounce. This comes after Tuesday’s significant rally of over 1%, driven by heightened geopolitical tensions in the Middle East. The conflict escalated when Iran launched approximately 200 missiles, including ballistic missiles, towards Tel Aviv, Israel’s capital.
Along with global instability, falling interest rates have continued to support gold, which remains just below its all-time high of $2,685. As interest rates decrease, gold becomes more appealing to investors due to its non-interest-bearing nature.
Gold Price Update: Volatility from Changing US Interest Rates
Gold’s recent volatility can be attributed to fluctuating expectations about US interest rates. These rate changes have also impacted the strength of the US dollar, a critical factor in the movement of gold prices.
Last week, gold price update surged as the Federal Reserve was expected to cut interest rates by 50 basis points at its November meeting. This expectation weakened the dollar, adding momentum to gold’s upward trajectory. However, robust US jobs data and a cautious speech by Federal Reserve Chairman Jerome Powell reduced the likelihood of a large rate cut. As of Wednesday, market estimates for a double rate cut had fallen to 37%.
Analysts Predict Further Gains for Gold
Despite gold’s substantial 28% rise in 2024, many analysts believe there is still room for growth. According to Kitco News, several major banks remain bullish on gold’s long-term prospects. Goldman Sachs recently raised its forecast for gold to $2,900 by early 2025, citing lower global interest rates, increased central bank demand, and gold’s hedging benefits as key drivers.
UBS Precious Metals Strategist Joni Teves also maintains an optimistic outlook, pointing out the macroeconomic conditions that favor gold’s growth. She emphasizes that the Federal Reserve’s easing policies and resilient physical demand are helping gold maintain its high prices. Additionally, central banks continue to add gold to their reserves, further supporting demand.
Technical Analysis: Gold Moves Along the 50 SMA
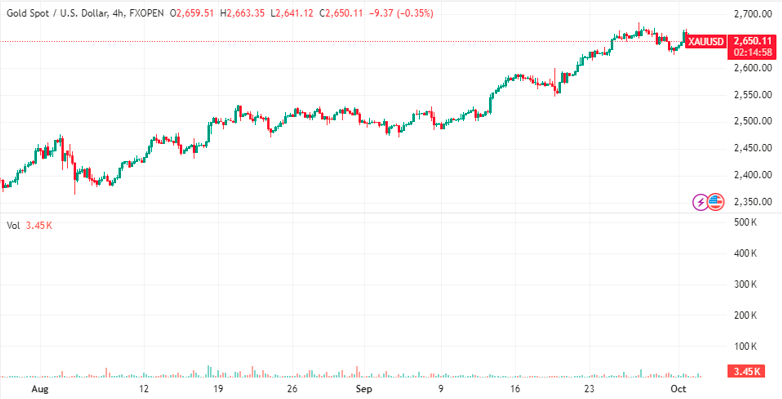
From a technical perspective, gold is currently retracing back to the 50-period Simple Moving Average (SMA) on the 4-hour chart. This marks the second pullback this week after bouncing off the $2,625 low on Tuesday.
Although the short-term trend is unclear due to recent fluctuations, a break above the $2,673 high set on October 1 could signal further gains. If gold surpasses this level, it may head towards the $2,680 region and potentially reach the round-number target of $2,700. However, a break below the $2,615-$2,620 range would signal a bearish reversal, suggesting a more extended pullback.
Long-Term Outlook for Gold Remains Positive
Despite recent corrections, gold’s long-term uptrend remains intact. Analysts believe that once the current period of consolidation is over, gold could resume its upward trajectory. The longstanding principle in technical analysis, “the trend is your friend,” applies here, suggesting a bullish outlook for gold in the medium to long term.
Conclusion
Gold’s recent pullback reflects the ongoing volatility in global markets, particularly with geopolitical tensions and changing expectations for US interest rates. However, analysts remain optimistic about gold’s future, with forecasts predicting higher prices in the coming years. For those interested in staying updated on gold prices and trends, you can explore our Daily Gold Signal and check the latest updates on Gold Forecast 2024.