
Analysis of recent gold price movements experienced a decline during the North American session. Prices hit a daily low of $2,430 and a high of $2,462, as the US Dollar strengthened. This recovery came after a report showing contraction in the manufacturing sector and weak labor market data. Currently, XAU/USD is trading at $2,438, reflecting a decrease of 0.35%.
Market Impact of Economic Reports
The Institute for Supply Management (ISM) report indicated a significant drop in manufacturing activity for July, reaching recessionary levels. This decline marks the lowest reading since December 2023 and has raised concerns about a potential economic slowdown. The Federal Reserve’s delayed response has fueled fears of a more severe economic downturn.
US equities saw sharp declines between 1.56% and 3.27%, while Treasury bond yields fell significantly. These movements have bolstered the appeal of gold and the US Dollar as safe-haven assets.
Labor Market Data and Federal Reserve Position
According to the US Bureau of Labor Statistics (BLS), unemployment benefits claims rose above expectations and previous weeks’ figures. Despite this, the Federal Reserve has opted against immediate rate cuts, citing skepticism about the disinflation process and the need for more data.
Geopolitical Risks Affecting Precious Metals
Geopolitical tensions, particularly recent conflicts between Hezbollah and Israel, have also impacted precious metal analysis of recent gold price movements. These tensions contribute to market uncertainty, influencing gold prices and investor behavior.
Upcoming Economic Indicators
The July Nonfarm Payrolls report, due on Friday, will be crucial for assessing the Federal Reserve’s future actions regarding employment concerns. Market expectations currently include 80 basis points (bps) of rate easing by late 2024.
Daily Digest Market Movers
- Federal Reserve: Maintained current rates; future adjustments may depend on inflation and labor market conditions.
- US Initial Jobless Claims: Increased to 248K for the week ending July 27, exceeding estimates.
- ISM Manufacturing PMI: Fell to 46.8, indicating deeper contraction and missing expansion forecasts.
- CME FedWatch Tool: Suggests a possible 25 bps rate cut in September.
Technical Analysis: Gold Price Trends
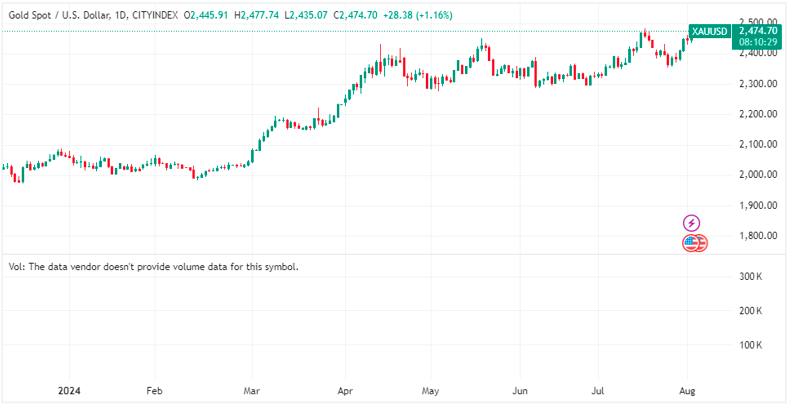
Gold’s uptrend remains, but resistance at recent highs may lead to a potential pullback. The Relative Strength Index (RSI) indicates reduced buying momentum, which could result in further corrections.
A drop below $2,400 might extend the decline to the July 30 low of $2,376. Further downside could occur if it breaks below the 50-day Simple Moving Average (SMA) at $2,362 and the 100-day SMA at $2,334. Conversely, if XAU/USD surpasses $2,450 and challenges the daily high at $2,462, the all-time high of $2,483 and the psychological $2,500 mark could be next.
For the latest updates on gold prices and market influences, visit Daily Gold Signal and check out Daily Gold Updates.