
Gold price trends have experienced significant fluctuations over the past week. After forming a descending triangle, they broke lower from the triangle’s apex, causing a notable drop. However, gold has since shown signs of recovery, creating a strong rebound from crucial support levels. Investors are watching closely to see how this rebound progresses, as it could signal the next direction for prices. Given the current trends, this pullback offers a promising opportunity for long-term investors to buy gold.
Gold Price Trends: Movements from Decline to Rebound
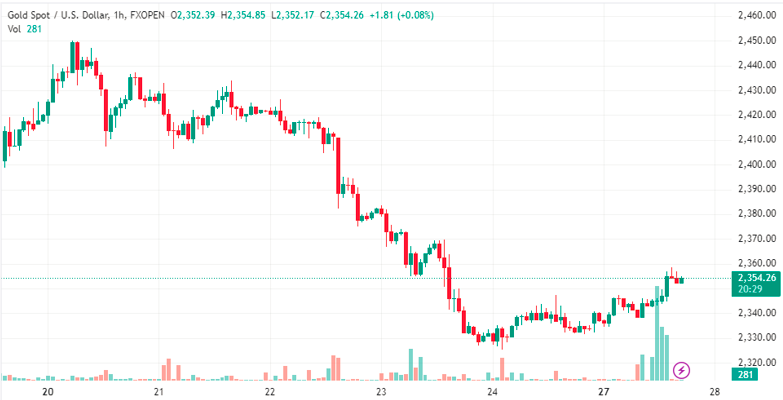
Last week, gold price trends formed a descending triangle, breaking lower from the triangle’s apex, which led to a sharp decline. However, following this drop, prices found strong support between $2,300 and $2,320, eventually bouncing back from these levels. The first resistance level encountered in this recovery was around $2,355, as indicated by the channel lines. This indicates a possible change in market direction.
Bear Flag Pattern and Market Volatility
Typically, the current gold market analysis channels suggest the formation of a bear flag pattern, which can be bearish if prices drop below the channel’s low point. In this case, the resistance for the bear flag stands around $2,356. Despite the volatility, gold’s market is beginning to show signs of strength after forming a bottom. With an ascending triangle now forming, there’s potential for continued upward movement. A break above the $2,356 resistance level could invalidate the bearish flag pattern, opening the way for further price gains.
Key Gold Resistance Levels to Watch
The immediate hurdle for gold’s recovery lies between $2,355 and $2,375. With increased unpredictability after last week’s fall, gold might stay within this broader range. If the price manages to close above $2,375, it would indicate that the uptrend remains strong. However, last week’s bearish weekly candle suggests some uncertainty, so monitoring these resistance levels is crucial for traders and investors.
Long-Term Outlook for Gold Investors
In the bigger picture, the gold market analysis appears optimistic for the medium term. After breaking past the critical $2,075 level, gold prices are showing potential for further growth. This recent dip offers a valuable opportunity for long-term investors, though seasonal fluctuations may bring about temporary volatility. Looking forward, support levels between $2,100 and $2,280 remain vital for the market’s stability.
Conclusion
The gold market has been turbulent recently, but key patterns point towards potential upward momentum. Investors should monitor support levels at $2,300-$2,320 and resistance between $2,355-$2,375 closely. A daily close above $2,375 would signal that the upward trend is likely to continue, despite last week’s mixed signals. With a positive outlook for the medium term, this dip presents a buying opportunity for those looking to invest in gold.
For more updates on the gold market, visit Daily Gold Signal. You can also explore our Daily Gold Updates to stay informed about the latest trends and analyses in the gold market.