
Gold price analysis three-day rally came to a halt as investors booked profits ahead of the crucial US Nonfarm Payrolls (NFP) report. The rise in US Treasury bond yields further weighed on the metal’s appeal. At present, XAU/USD remains steady at $2,918, showing little movement.
Key Points For Gold Price
- Gold consolidates above $2,900 amid investor caution.
- Rising US Treasury yields limit gold’s upside momentum.
- Uncertainty from US trade policies adds market volatility.
- Mixed US economic data fuels speculation ahead of the NFP report.
- Technical indicators suggest a possible breakout or pullback.
Market Context: Gold Price Analysis Consolidates Amid Mixed US Data
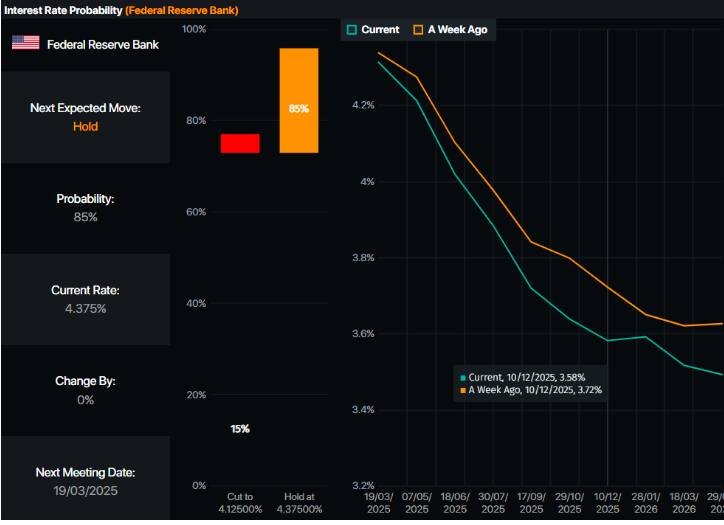
The yellow metal remains firm above the $2,900 level, with the US 10-year Treasury bond yield reaching a one-week high before retracting to 4.286%. The latest US economic data presents a mixed outlook, keeping traders on edge.
Market uncertainty persists due to proposed trade policies from US President Donald Trump. New tariffs on key trading partners have prompted retaliatory actions from Canada and China. Meanwhile, Mexico secured a temporary delay on tariffs until April 2 following discussions between Trump and Mexico’s President Claudia Sheinbaum on border security and fentanyl control.
Gold Price Analysis: US Economic Indicators in Focus
The latest US labor market data paints a conflicting picture:
- Jobless Claims: Initial jobless claims for the week ending March 1 rose to 221K, below the 235K forecast but lower than the previous week’s 242K.
- Challenger Job Cuts: Layoffs surged from 49.8K to 172K, with the federal government responsible for over 62,000 job cuts.
- GDP Forecast: The Atlanta Fed GDPNow Model revised Q1 2025 GDP projections to -2.4%, improving from an earlier -2.8% estimate.
Traders will closely monitor Friday’s NFP report, which is expected to show 160K jobs added to the workforce. A stronger-than-expected report could pressure gold prices, while a weaker number might fuel a bullish breakout.
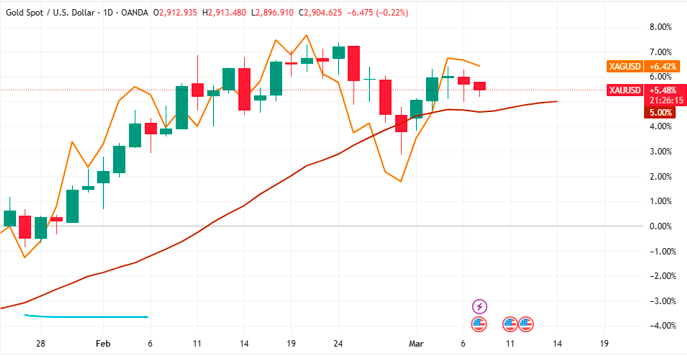
Technical Analysis: XAU/USD Forecast Holds Above $2,900
Gold price analysis action reflects indecision, with two consecutive Doji candlesticks signaling a balance between buyers and sellers. The Relative Strength Index (RSI) remains in bullish territory but suggests fading momentum.
Resistance Levels:
- $2,950 – Initial resistance level.
- $2,954 – Record high.
- $3,000 – Psychological barrier if bullish momentum persists.
Support Levels:
- $2,900 – Key support level.
- $2,832 – February 28 low.
- $2,800 – Major downside target if bearish pressure increases.
Conclusion
Gold traders await the NFP data to determine the next market direction. A stronger report could pressure gold lower, while weaker data might fuel a breakout above $2,950. Investors should keep an eye on US Treasury yields and global trade developments for further price action cues.
Learn more about market trends at Daily Gold Signal. For daily gold updates, visit Daily Gold Update.