The gold price decline (XAU/USD) dipped during the early European session on Monday. This decline followed the People’s Bank of China (PBoC) deciding to pause gold purchases for the second month in June, according to data released on Sunday. As China is the largest consumer of gold globally, this pause could negatively impact the gold price.
Influence of US Federal Reserve Speculations
Conversely, speculation about a potential interest rate cut by the US Federal Reserve (Fed) in the third quarter might support the non-yielding gold price. Additionally, political uncertainty in France, stemming from exit polls suggesting a hung parliament after the French parliamentary elections, could drive investors towards safe-haven assets like gold. Investors are also keenly awaiting Federal Reserve Chair Jerome Powell’s testimony on Tuesday and the US June Consumer Price Index (CPI) inflation data on Thursday.
Market Movers and Employment Data
Gold price decline weakened further as the PBoC refrained from gold purchases for the second month. The US Nonfarm Payrolls (NFP) increased by 206,000 in June, surpassing the market expectation of 190,000 but down from the revised 218,000 in May. The Unemployment Rate rose slightly to 4.1% in June from 4% in May. Average Hourly Earnings, a measure of wage inflation, fell to 3.9% year-over-year in June, aligning with market expectations. This employment data has increased the likelihood of a Fed rate cut in September, with market odds rising to 77% from 70% before the report.
French Political Uncertainty and Gold Prices
In an unexpected result, polls indicate that the left-wing New Popular Front (NFP), led by Jean-Luc Mélenchon, may secure the most seats in the second round of the French parliamentary elections. According to The Economist, this political uncertainty in France may further boost the demand for safe-haven assets like gold.
Technical Analysis of Gold Prices
Despite the daily dip, gold maintains a bullish trend on the daily chart, staying above the critical 100-day Exponential Moving Average (EMA). The yellow metal has broken out above a descending trend channel formed on May 10, suggesting the path of least resistance is upward. The 14-day Relative Strength Index (RSI) remains in the bullish zone above the 50-midline.
The initial upside barrier for XAU/USD is the $2,400 psychological level, followed by $2,432, the high from April 12. The next potential resistance is the all-time high of $2,450. On the downside, the first support level is the $2,330-$2,340 zone, a low from June 17 and a former resistance zone. Further losses could see gold drop to $2,273, the 100-day EMA.
US Dollar Performance Today
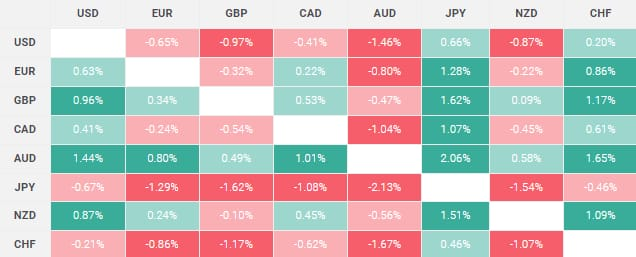
The table below shows the percentage change of the US Dollar (USD) against major currencies today.The US Dollar performed the poorest against the Swiss Franc. This heat map demonstrates the percentage changes of major currencies against each other, with the base currency from the left column and the quote currency from the top row.
Conclusion
The gold market is influenced by various factors, including central bank policies, economic data, and geopolitical events. Investors should stay informed and adjust their strategies accordingly.
For more detailed updates on gold prices, you can visit Daily Gold Signal. For daily gold updates, check here.