
Gold price rally continued its bullish momentum on Wednesday, breaking above a key resistance level at $2,930. This breakout surpasses the 78.6% Fibonacci retracement level at $2,930, where gold had been consolidating for nearly a week. Additionally, the 20-Day Moving Average (MA) at $2,913 was reclaimed and tested as support, with the session’s low at $2,906. This development signals a strengthening trend.
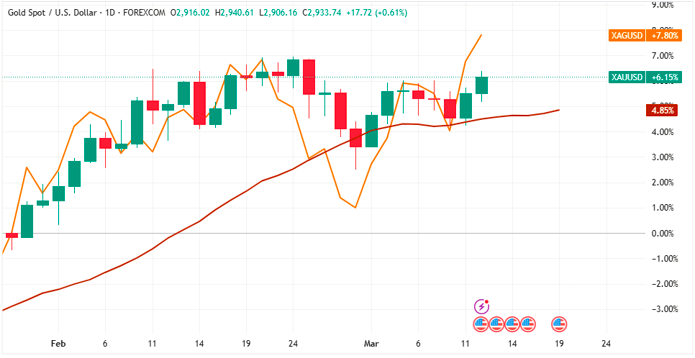
The current high of the day stands at $2,940, and if gold closes above this level, it will confirm the breakout’s strength. Presently, trading remains above this threshold, positioning gold for one of its highest daily closing prices ever recorded.
Key Takeaways for Gold Price:
- Gold surges past $2,930, reclaiming the 20-Day MA at $2,913.
- Potential new record high as gold eyes $2,956 and beyond.
- Weekly breakout confirmed, reinforcing the bullish trend.
- RSI divergence signals caution, hinting at a possible momentum slowdown.
Potential Challenge to Record High of $2,956
The recent pullback to a swing low of $2,833 and the subsequent rally place gold in a strong position to attempt a new record high. The current all-time high of $2,956, set in late February, is now within reach.
Gold price rally first upside target stands at $2,978, derived from a rising ABCD pattern, which aligns with another target at $2,982. Beyond this, the next critical level to watch is the 127.2% Fibonacci extension of the latest bearish retracement, positioned at $2,990.
Weekly Breakout Confirms Strength
This breakout is further validated by a weekly breakout, surpassing last week’s high. Notably, last week formed an inside week pattern, making this breakout significant. If gold maintains a weekly close above $2,930, it will solidify the uptrend on a higher time frame.
Bearish RSI Divergence Raises Concerns
Despite strong bullish momentum, a potential concern arises from a bearish divergence in the Relative Strength Index (RSI), signaling waning buying pressure. Additionally, last month ended with a bearish shooting star candlestick pattern, suggesting possible resistance near $2,956.
For now, gold’s price action remains bullish, but traders should monitor whether momentum weakens as it approaches record highs. If selling pressure increases, it may temporarily stall the rally.
For further insights and gold trading signals, visit Daily Gold Signal. For daily updates and market analysis, check out Daily Gold Update.