
Gold price rebound factors (XAU/USD) have surged beyond $2,470 in Friday’s American trading session. This sharp rise follows a weaker-than-expected US Nonfarm Payrolls (NFP) report for July. The report, published by the Bureau of Labor Statistics (BLS), indicated a cooling labor market, which has impacted bond yields and the US Dollar. This blog explores how these developments have influenced the gold market and what to expect next.
Impact of US NFP Report
The US NFP Report for July revealed that job creation was lower than anticipated, with only 114,000 new jobs added compared to the forecast of 175,000. The previous report was also revised downward to 206,000. Additionally, the Unemployment Rate increased to 4.3% from 4.1%, adding further pressure on the US Dollar.
Decline in Bond Yields
The report’s results led to a significant drop in 10-year US Treasury yields, falling to a six-month low of approximately 3.82%. Lower yields on interest-bearing assets diminish the opportunity cost of holding non-yielding assets like gold. Consequently, gold market trends have been buoyed by this shift.
Movement in US Dollar Index
The US Dollar Index (DXY), which measures the Dollar against a basket of major currencies, has also declined, reaching a fresh four-month low of around 103.30. This decline in the Dollar further supports gold’s appeal as a safe-haven asset.
Wage Growth and Inflation Concerns
Average Hourly Earnings, a crucial indicator of wage growth, increased at a slower pace in July. Yearly wage growth decelerated to 3.6%, below the 3.7% forecast. Month-on-month growth also slowed to 0.2% from expectations of 0.3%. This softer wage growth suggests lower inflation pressures, which could enhance prospects for Federal Reserve rate cuts.
Market Movers: Geopolitical Tensions and Economic Data
Gold price rebound factors have also been influenced by escalating geopolitical tensions. Reports of heightened risks between Iran and Israel have strengthened gold’s safe-haven status. Additionally, weak US economic data, including a drop in the ISM Manufacturing PMI and rising Initial Jobless Claims, have contributed to gold’s upward movement.
Technical Analysis
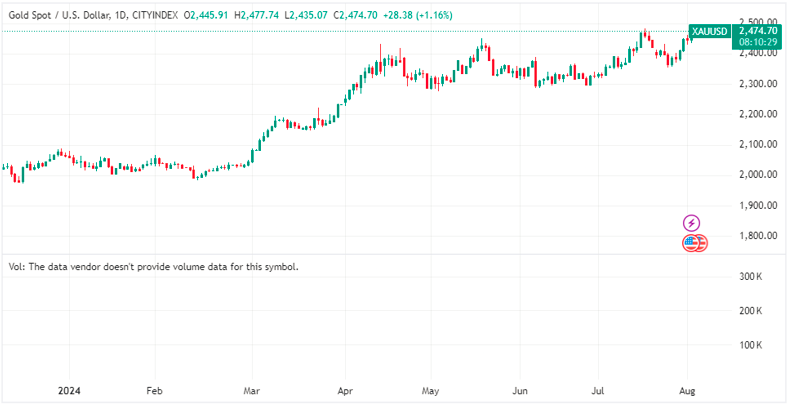
Currently, gold trades within a channel pattern on the daily chart. The 50-day Exponential Moving Average (EMA) near $2,370 continues to support the bulls. The 14-day Relative Strength Index (RSI) has risen to nearly 60.00, suggesting potential further gains if it climbs above this level. A break above the all-time high of $2,483.75 could push gold into new territory. Conversely, the trendline at $2,225, drawn from the October 6 low, provides long-term support.
In conclusion, gold’s recent price surge above $2,470 reflects the market’s reaction to weaker US economic data and geopolitical tensions. As the Federal Reserve considers potential rate cuts and economic conditions evolve, gold remains a critical asset to watch.
For daily updates on gold prices, visit Daily Gold Signal. For more detailed reports and market analysis, check the Daily Gold Update category.