
The gold price (XAU/USD) has been fluctuating recently, bouncing off multi-day lows but struggling to rise above the $2,500 mark. This comes as the US Dollar strengthens, creating headwinds for the yellow metal. Despite this, ongoing geopolitical tensions and the possibility of Federal Reserve (Fed) rate cuts could provide support to gold in the coming days.
Upcoming Economic Data and Market Impact
Later today, the market will focus on the release of the JOLTS Job Openings and the Fed Beige Book. However, the key event this week is the US Nonfarm Payrolls (NFP) report for August, set to be released on Friday. This report is critical as it could influence the Fed’s decision on interest rates during its September meeting.
If the NFP data shows a weaker-than-expected result, it could raise concerns about a potential US recession. This may lead to faster Fed rate cuts, which typically support gold prices by reducing the opportunity cost of holding non-yielding assets like gold.
Market Movers: The Role of the US Dollar and Economic Data
In recent market movements, the gold price has faced pressure due to a stronger US Dollar. For instance, China’s Caixin Services PMI for August fell short of expectations, coming in at 51.6 compared to the anticipated 52.2. This contributed to a mixed sentiment in the market.
According to Daniel Ghali, a commodity strategist at TD Securities, speculative positions in gold appear to have reached their peak. He notes that the pressure on gold from the rising dollar is consistent with market positioning. Additionally, the US ISM Manufacturing PMI rose slightly to 47.2 in August, but still fell short of market expectations, further influencing trader sentiment.
The US JOLTS Job Openings data, which is projected to show 8.10 million openings, will also be closely watched. Meanwhile, the ISM Services PMI for August is expected to show a modest increase to 51.4 from 51.1 in July.
Technical Analysis: Gold Price Trends
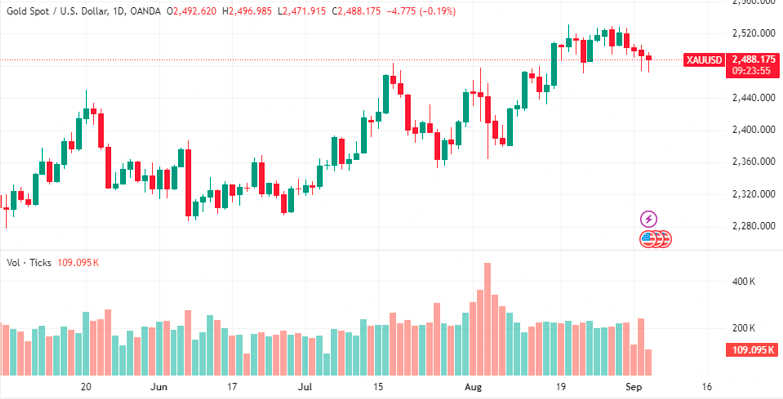
From a technical standpoint, the gold price remains in a positive trend over the longer term. The metal is trading above its key 100-day Exponential Moving Average (EMA), which supports its bullish outlook. The 14-day Relative Strength Index (RSI) also indicates a bullish trend as it remains above the midline.
The main resistance level for gold is between $2,530 and $2,540, which aligns with the upper boundary of a five-month-old ascending channel. If gold manages to break above this level, it could pave the way for a move towards the psychological $2,600 mark.
On the downside, immediate support lies at $2,470, the low recorded on August 22. A breach of this level could lead to a further decline towards $2,432, the low from August 15. If losses continue, gold could drop to the 100-day EMA at $2,377.
Conclusion
As traders await key economic data, the gold price continues to navigate a challenging environment influenced by the strength of the US Dollar and expectations of Federal Reserve rate cuts. Investors should keep a close eye on the upcoming Nonfarm Payrolls report, as it could significantly impact gold’s direction in the near term.
For more detailed updates, visit the Daily Gold Signal. You can also find the latest gold price analysis in our Daily Gold Update.