
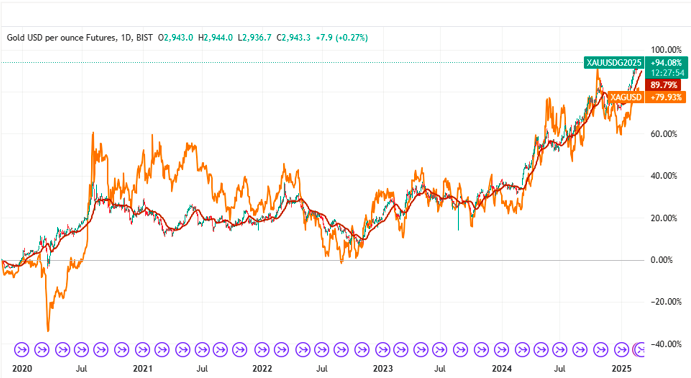
The gold price trends continues to hover near its all-time peak, struggling to gain significant momentum during the Asian trading session. Despite the ongoing uncertainty surrounding US trade policies and geopolitical tensions, the precious metal remains confined within a multi-day trading range. This article delves into the key factors influencing gold prices, including trade war fears, Federal Reserve rate expectations, and technical indicators.
Key Takeaways
- Gold prices remain steady near all-time highs amid trade tensions and geopolitical risks.
- Federal Reserve rate expectations and US inflation data are critical drivers of XAU/USD.
- Technical indicators suggest overbought conditions, hinting at potential consolidation.
Market Context: Trade Tensions and Geopolitical Risks
The gold price trends has been buoyed by a combination of factors, including ongoing trade tensions and a broader risk-averse sentiment in global markets. US President Donald Trump’s tariff plans have raised concerns about their potential impact on the global economy, driving demand for safe-haven assets like gold.
Recent data has further fueled these concerns. The S&P Global US Composite PMI dropped to 50.4 in February, signaling weaker business activity. Additionally, the University of Michigan’s Consumer Sentiment Index fell to a 15-month low, reflecting growing economic uncertainty.
Federal Reserve Rate Outlook: A Key Driver
While trade tensions support gold prices, the Federal Reserve’s monetary policy remains a critical factor. Expectations that the Fed will maintain higher interest rates for longer, coupled with sticky inflation, have capped gold’s upside potential.
The upcoming release of the US Personal Consumption Expenditures (PCE) Price Index on Friday will provide further clarity on the Fed’s rate-cut path. This data, along with other economic indicators like the Prelim US Q4 GDP and Durable Goods Orders, will influence the US Dollar’s trajectory and, in turn, gold prices.
Technical Insights: Overbought Conditions and Key Levels
From a technical perspective, the daily Relative Strength Index (RSI) indicates overbought conditions, suggesting that gold prices may consolidate further. Key resistance levels to watch include the 2,950−2,955 range, while supportlies near the 2,950−2,955 range, while supportlies near the 2,920-2,915 zone.
A decisive break above resistance could signal a fresh bullish trend, while a drop below support levels might lead to a corrective pullback. Traders should monitor these levels closely for potential trading opportunities.
Expert Opinions: A Balanced Perspective
Market analysts highlight the dual impact of trade tensions and Fed policy on gold prices. While geopolitical risks provide a tailwind, the Fed’s hawkish stance acts as a headwind. As one expert noted, “Gold’s status as a hedge against inflation and economic uncertainty remains intact, but its near-term trajectory will depend heavily on the Fed’s next moves.”
Conclusion: What’s Next for Gold Prices?
Gold prices remain near all-time highs, supported by trade tensions and geopolitical risks. However, the Federal Reserve’s rate outlook and upcoming economic data will play a pivotal role in determining the precious metal’s near-term direction.
For the latest updates on gold prices and market trends, visit Daily Gold Signal. For more insights on daily gold updates, check out Daily Gold Updates.