
Gold prices (XAU/USD) have slightly retreated, settling in the $2,570 range following the release of the US Retail Sales data for August. This report, which serves as the last significant economic indicator before the Federal Reserve’s upcoming interest rate decision, has sparked speculation on the future of US monetary policy. The shift in retail sales growth has led to a reassessment of interest rate cut expectations, which in turn has impacted gold prices.
US Retail Sales Data: A Closer Look
The latest US Census Bureau data shows that retail sales rose by 0.1% month-on-month in August. This was a notable slowdown compared to the revised 1.1% growth observed in July. The August figures exceeded market expectations, which anticipated a 0.2% decline. This unexpected rise in retail activity suggests a slightly more robust economy than expected.
Excluding auto sales, retail sales also grew by 0.1% in August, down from a 0.4% increase in July. However, this was below the projected rise of 0.2%. Despite these figures, the prospect of a larger 0.50% rate cut by the Federal Reserve at its September meeting has marginally decreased. Before the data release, there was a 67% chance of such a cut, but this figure dropped to 65%, based on the CME FedWatch tool.
The Impact on Gold Prices
Gold prices surged to an all-time high of $2,589 on Monday, fueled by expectations of a significant interest rate cut by the Federal Reserve. Market sentiment had built around the idea of a potential double 0.50% cut, which would make gold more attractive to investors. This is because lower interest rates reduce the opportunity cost of holding gold, a non-yielding asset, making it a more appealing option during periods of monetary easing.
Technical Outlook: Gold’s Price Action
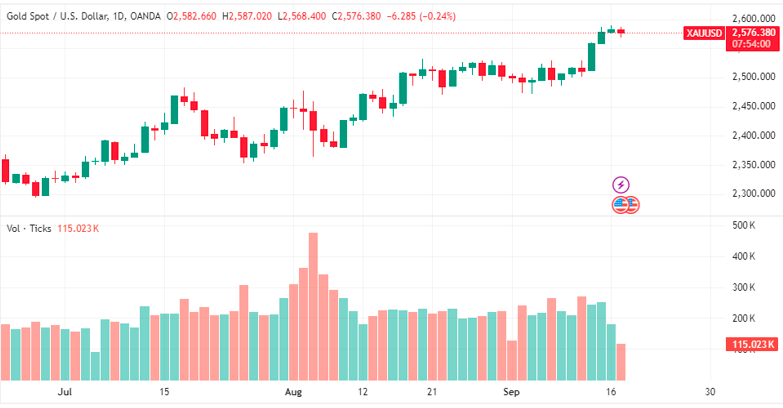
Although gold prices has pulled back to the $2,570s, the broader trend remains bullish. In technical analysis, “the trend is your friend,” and this applies to gold’s current market position. Gold’s upward momentum is expected to continue, with any short-term corrections likely to be temporary.
The Relative Strength Index (RSI), a key technical indicator, shows that gold is nearing overbought territory. If it reaches this zone, traders may hold off on adding to their long positions. However, should the RSI dip back into neutral, it could signal a deeper correction.
In the event of a pullback, support levels to watch include $2,550, $2,544 (which aligns with the 0.382 Fibonacci retracement of September’s rally), and $2,530, a former high.
Conclusion
Gold’s slight decline after the US Retail Sales report reflects a recalibration of market expectations regarding Federal Reserve interest rate cuts. The broader trend, however, suggests continued bullish momentum for the yellow metal. As traders assess the Federal Reserve’s next moves, the outlook for gold remains optimistic.
For more insights into gold trading strategies and daily updates, you can visit Daily Gold Signal. For a deeper analysis of gold’s movements, check out the Daily Gold Update.