
Gold price analysis (XAU/USD) has rebounded, trading in the $2,340s on Thursday. This recovery is fueled by the weakening US Dollar (USD) after the second estimate of the US GDP was released. The revision, reflecting slower consumer spending, has driven Gold’s upward momentum.
US GDP Data Revision: Impact on Gold Prices
The US Bureau of Economic Analysis revised the Q1 annualized GDP growth down to 1.3% from the initial estimate of 1.6%. This is notably lower than the 3.4% growth recorded in Q4, aligning with analysts’ forecasts. As a result, US Treasury yields have declined, indirectly boosting Gold price analysis since Treasury yields and Gold generally move in opposite directions.
This revised GDP data suggests that the US economy might not be as strong as initially thought, potentially leading to a decrease in inflation. If inflation falls, the Federal Reserve (Fed) may consider lowering interest rates, which would make Gold a more attractive investment due to lower opportunity costs.
Challenges for Gold: Interest Rates and European Inflation
Despite Gold’s recent gains, it remains under pressure due to the outlook on US interest rates and rising inflation in Europe.
On Tuesday, Minneapolis Fed President Neel Kashkari surprised markets by suggesting that the Fed might not be done with interest rate hikes. He also hinted that the Fed could lower rates twice by the end of 2024 if necessary. This uncertainty keeps Gold’s future trajectory in question.
Meanwhile, inflation in Europe is exceeding expectations. Data from Germany and Spain shows higher-than-expected inflation rates, which reduces the likelihood of the European Central Bank (ECB) cutting interest rates soon.
In May, Germany’s Harmonized Index of Consumer Prices (HICP) rose by 2.8% year-on-year, exceeding predictions of 2.7%. Similarly, Spain’s preliminary HICP for May surged by 3.8%, surpassing forecasts. These strong inflation figures suggest that the Eurozone’s overall HICP, due on Friday, might also be higher than expected, pushing the ECB to reconsider its stance on interest rates.
Technical Analysis: Gold’s Breakout from Bear Flag Formation
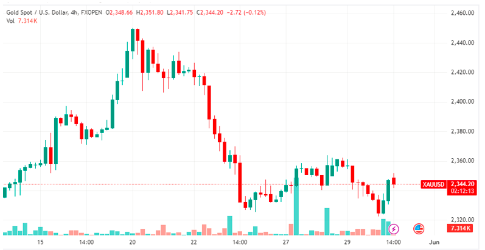
Technically, Gold has broken out of a rectangular pattern, resembling a Bear Flag formation, which typically signals a continuation of downward trends. This pattern developed between May 24 and 27, indicating a potential further decline in Gold prices.
XAU/USD 4-Hour Chart Analysis
The breakout from this Bear Flag suggests a significant downside target range between $2,303 and $2,295, with further bearish confirmation if Gold breaks below Thursday’s low of $2,322. The first target aligns with the Fibonacci 0.618 extrapolation of the previous downward movement, while the second target matches the 0.618 Fibonacci extension of the flagpole.
If the bearish scenario unfolds, Gold could potentially drop to $2,272, corresponding to the 100% extrapolation before the trend-line break.
Although the short-term trend appears bearish, the medium and long-term outlooks for Gold remain bullish, indicating recovery potential. For a bullish reversal, Gold must decisively break above the current trendline around $2,385. A strong bullish signal would be a long green candle or three consecutive green candles, indicating a reversal of the short-term downtrend.
Conclusion
Gold’s recent recovery, driven by the revised US GDP data, highlights its ongoing sensitivity to economic indicators and interest rate expectations. While the current outlook presents challenges, especially with rising inflation in Europe and uncertain US interest rates, the precious metal retains potential for recovery in the long term.
For further insights into the latest Gold trends and updates, visit our Daily Gold Update and check out more strategies at Daily Gold Signal.