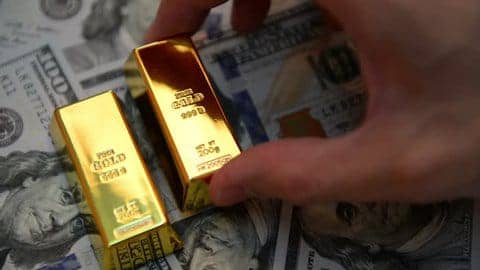
On Monday, the price of gold, which is measured in dollars (XAU/USD), went up by almost one percent, reaching the $2,320s. This happened because people are thinking about how the recent US jobs data, which wasn’t as good as expected, might affect interest rates. Interest rates are important for gold prices. Also, people are looking at economic news from China, a big buyer of gold, and it seems like things are going well there. Central banks are still buying a lot of gold, which is keeping the prices high.
Gold Price Climbs Following US Jobs Report and Positive Economic Data from China
“Gold Price Bounces Back as Investors Think About Interest Rates”
On Monday, the price of gold went up again because investors are thinking about what might happen with interest rates. This came after recent news about how many people got jobs in the US in April. The report showed that fewer people got jobs than expected, and the amount of money people were earning didn’t go up as much as economists thought it would.
This news makes some people think that the Federal Reserve, the central bank of the US, might lower interest rates sooner than they thought. When interest rates are lower, it’s more appealing to invest in gold because you’re not giving up as much potential profit by holding onto gold instead of something else that earns interest.
Also, new data from China on Monday showed that the service sector, which includes things like restaurants and transportation, is still doing well. This is good news because China is a big buyer of gold. So, even though China has had some economic problems recently, this news suggests that they might still want to buy gold, which keeps the demand high.
Central Banks Maintain Net Positive Acquisitions of Gold
In March, central banks around the world continued to buy more gold than they sold, adding a net total of 15 tonnes to their reserves. This trend has been ongoing for a while, with central banks being big buyers of gold lately. The latest numbers match what we’ve seen in previous months, showing that the demand for gold among central banks is staying strong.
Krishan Gopaul, a senior analyst at the World Gold Council, noted that this buying trend has persisted into 2024, with banks in emerging markets leading the way in both buying and selling gold.
Gold Price Begins Oscillating Within a Range: A Technical Analysis
The price of gold, which is measured in XAU/USD, has recently started moving sideways on the 4-hour chart. This chart helps experts look at short-term trends. Right now, the price has gone up to around $2,326, which is like a ceiling, and then it came back down a bit. At this same level, there’s something called the 50 Simple Moving Average (SMA), shown in red on the chart.
XAU/USD 4-Hour Chart Analysis

The price might keep going down and could reach around $2,280, or it might break above the top of the range and start moving toward a higher level at $2,353. This $2,353 level is important because it matches with the highest point gold reached in late April and also with the top of something called “wave B.”
If the price breaks above this range top, it could mean it’s likely to go even higher, maybe reaching $2,370. We would know it’s a decisive break if we see a longer green candlestick that goes above the range top and closes near its highest point, or if we see three green candlesticks in a row that break above this level.
Unfinished Measured Move: Analyzing Potential Price Action
It seems like the price of gold might be following a pattern called a “bearish Measured Move,” which started on April 19. This pattern usually has three parts called waves A, B, and C. Wave C often ends up being the same size as wave A or a certain fraction of it, like 0.681.
Right now, the price has dropped to around $2,286, which is a conservative estimate for the end of wave C. But there’s a chance that wave C could go even lower and reach around $2,245, which would be the same size as wave A. This move would be confirmed if the price decisively breaks below the range it’s been trading in and goes below the low point reached on May 3, which was $2,277.


