
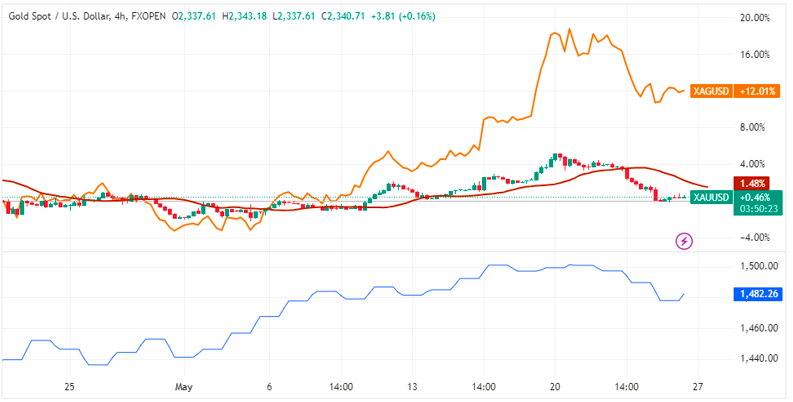
Gold (XAU/USD) experienced marginal gains, trading around the $2,330 mark on Friday. The lack of clear direction in Asian markets and mixed signals from the US about future interest rates are contributing to the current uncertainty in gold trading.
2. Gold Trades in a Range During Economic Ambiguity
Gold trades in a range due to conflicting signals, especially regarding US interest rates. The economic data from the US indicates a trend towards lower inflation, which would typically lead to decreased interest rates. Lower interest rates generally benefit gold by reducing the opportunity cost of holding the non-yielding asset. However, the timing and extent of rate cuts remain unclear.
3. Impact of US Producer Price Index Data
The recent release of the disinflationary US Producer Price Index (PPI) on Thursday showed a reduction in inflationary pressures, suggesting the Federal Reserve (Fed) might cut interest rates soon. Despite this, the Fed revised down the number of expected rate cuts for 2024 from three to one. Fed Chairman Jerome Powell emphasized a data-dependent approach, despite cooler-than-expected Consumer Price Index (CPI) data in May.
4. Gold Trades in a Range with Price Fluctuations
Gold prices rose over 0.5% to a peak of $2,342 after the CPI data release but fell back due to the Fed’s cautious stance. The robust US Nonfarm Payrolls (NFP) figures on Friday indicated a strong labor market and rising wages, potentially increasing inflation and keeping interest rates high.
5. Influence of China’s Gold Reserves
Gold was also impacted by the People’s Bank of China (PBoC) halting gold purchases between the end of April and May, the first time in 18 months. This pause suggested a possible price cap, although Citibank analysts pointed to strong consumer demand in China, predicting higher gold prices.
6. Upcoming Data: Michigan Consumer Sentiment Index
Gold traders now await the preliminary Michigan Consumer Sentiment Index for June, set to be released on Friday. This data will provide further insights into the economic outlook and potential interest rate movements.
Technical Analysis: Bearish Head-and-Shoulders Pattern
Daily Chart Analysis
Gold trades in a range while forming a bearish Head-and-Shoulders (H&S) pattern on the daily chart, often indicating a market top and a potential trend reversal. The neckline of this pattern is at the $2,279 support level. Decreasing trade volume supports this pattern’s validity.
Downside Targets
A break below the neckline would confirm the H&S pattern and suggest further downside targets. The first target is $2,171, calculated using the 0.618 Fibonacci ratio of the pattern’s height. The second target is $2,106, based on the full height of the pattern. Conversely, a break above $2,345 would challenge the H&S pattern and could signal a continuation higher to $2,450.
Conclusion
Gold trading remains uncertain due to mixed economic signals from the US and global influences like China’s purchasing behavior. Traders are closely monitoring upcoming data releases to gauge future price movements. For more updates and detailed gold analysis, visit Daily Gold Signal and explore the Daily Gold Update for the latest insights.