
Impact of US Retail Sales on Gold (XAU/USD) has recently corrected some of its early gains, trading in the $2,440s. This movement follows the release of US Retail Sales data, indicating that consumers continue to spend despite high borrowing costs. This resilience in consumer spending suggests that inflation may remain elevated, which could influence future Federal Reserve interest rate decisions and impact gold prices.
Overview of Gold Price Movements
Prior to the data release, gold price trends were climbing, inching toward the all-time high of $2,451. This rise was driven by expectations that the Federal Reserve would lower interest rates at its September meeting due to signs of cooling inflation.
Reaction to US Retail Sales Data
Following the release of June’s Retail Sales data, gold prices experienced a pullback. US Retail Sales remained unchanged at 0.0%, which was below May’s upwardly revised figure of 0.3%. However, Retail Sales excluding autos showed a 0.4% increase, exceeding the estimated 0.1% rise.
The Retail Sales Control Group, which adjusts for seasonal variations, reported a 0.9% increase, up from 0.4% in May. This group is often viewed as a more reliable indicator of consumer spending.
Gold’s Rise After Fed Chairman’s Comments
Earlier on Tuesday, gold price trends increased after remarks from Fed Chairman Jerome Powell. He indicated that inflation was moving closer to the central bank’s target and hinted at upcoming interest rate cuts. This led to a significant shift in market expectations regarding the Fed Funds rate.
According to the CME FedWatch tool, there is now a 100% chance of at least a 0.25% cut in the Fed Funds rate during the September meeting, a notable increase from just above 60% prior to Powell’s comments.
Technical Analysis: Gold’s Price Range
Gold is currently trading within a defined range as it approaches the all-time high set on May 20. The precious metal appears to be in a phase of sideways consolidation, which acts as a pause within a broader upward trend.
XAU/USD Daily Chart
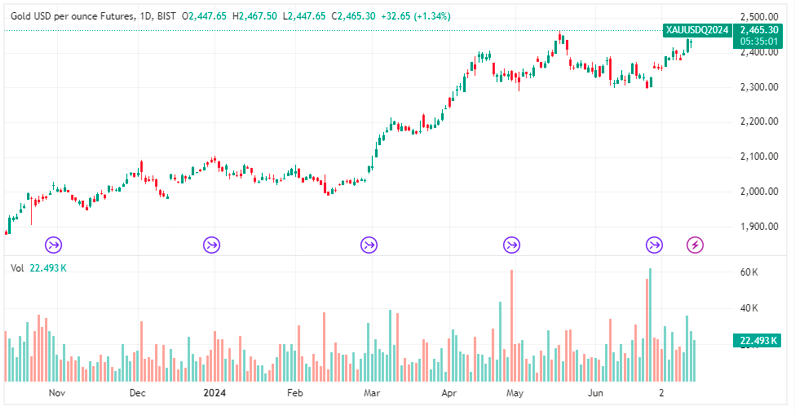
Short-term analysis indicates that gold may be extending a leg higher within a range established since April. The lower boundary of this range is approximately $2,280, while the upper boundary is $2,451.
Since breaking above the June 7 peak of $2,388, gold has received bullish confirmation, setting the next upside target at the $2,451 all-time high.
In the long term, the upward trend in gold suggests a favorable outlook for a potential breakout above the range.
If gold decisively breaks above the $2,451 high, the next target would be $2,555, determined using the 0.618 Fibonacci ratio of the height of the established range.
Conclusion
In summary, the impact of US Retail Sales data on gold prices highlights a complex relationship between economic indicators and market behavior. For daily updates on gold prices, visit Daily Gold Signal. For ongoing insights, explore our Daily Gold Update.