Gold prices (XAU/USD) fell into the $2,330 range on Thursday, with the 50-day Simple Moving Average (SMA) acting as support. This drop is due to rising global interest rates, which make holding gold, a non-interest-bearing asset, more expensive and less attractive.
Why Gold is Struggling: The Impact of Interest Rates
Gold prices have been dropping after a brief period of stability. This decline is mainly because the Federal Reserve (Fed) hinted that US interest rates might stay high. Additionally, inflation in Europe is higher than expected, adding further pressure on gold investments.
On Tuesday, Minneapolis Fed President Neel Kashkari mentioned that the Fed might raise interest rates again, possibly twice by the end of 2024 if borrowing costs decrease.
At the same time, inflation in Germany and Spain was higher than predicted. This reduces the chances of the European Central Bank (ECB) cutting interest rates after a planned reduction in June. According to Eurostat, Germany’s Harmonized Index of Consumer Prices (HICP) rose by 2.8% in May, slightly above forecasts. Similarly, Spain’s HICP increased by 3.8%, exceeding expectations.
These inflation numbers suggest that the overall Eurozone inflation, to be released on Friday, could also be higher than expected. This might force the ECB to rethink its plan to lower interest rates.
Gold Price Patterns: What the Charts Show
Technically, gold investments have broken out of a rectangular pattern, which could be a Bear Flag formation. This pattern typically signals further downward movement, with potential price targets between $2,303 and $2,295. If gold drops below $2,322, it would confirm this bearish trend.
The first target of $2,303 is based on the Fibonacci 0.618 extension of the previous downward move. In a more severe decline, gold could fall to $2,272, which is the 100% extension of the earlier movement.
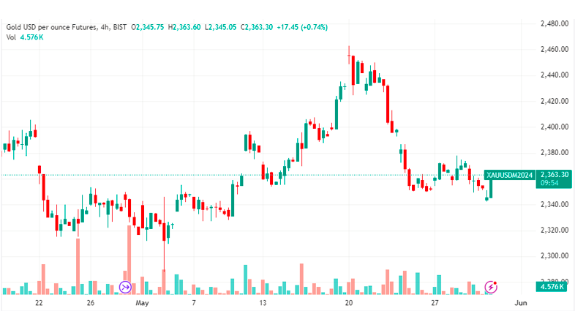
The 4-hour chart of gold shows a pattern of lower highs and lows, indicating a short-term downtrend. This suggests that taking short positions (betting on a price drop) may be more favorable now, even though the longer-term outlook for gold remains positive.
Signs of Recovery and What to Watch For
For gold to reverse its short-term downtrend, it needs to break above the trendline at around $2,385. This would be confirmed by strong bullish signals, like a long green candle or three consecutive green candles on the chart.
Despite the current challenges, gold still has the potential to recover if these bullish signs appear.
Conclusion
In simple terms, rising interest rates and higher inflation in Europe are putting pressure on gold prices. Technically, gold is showing bearish patterns, but there’s still hope for a recovery if key resistance levels are broken. Investors should keep an eye on these trends and consider short-term strategies, while staying mindful of gold’s long-term potential.
For more information on gold price movements and strategies, check out our Daily Gold Signal page, and stay updated with our Daily Gold Updates.